Complete Overview
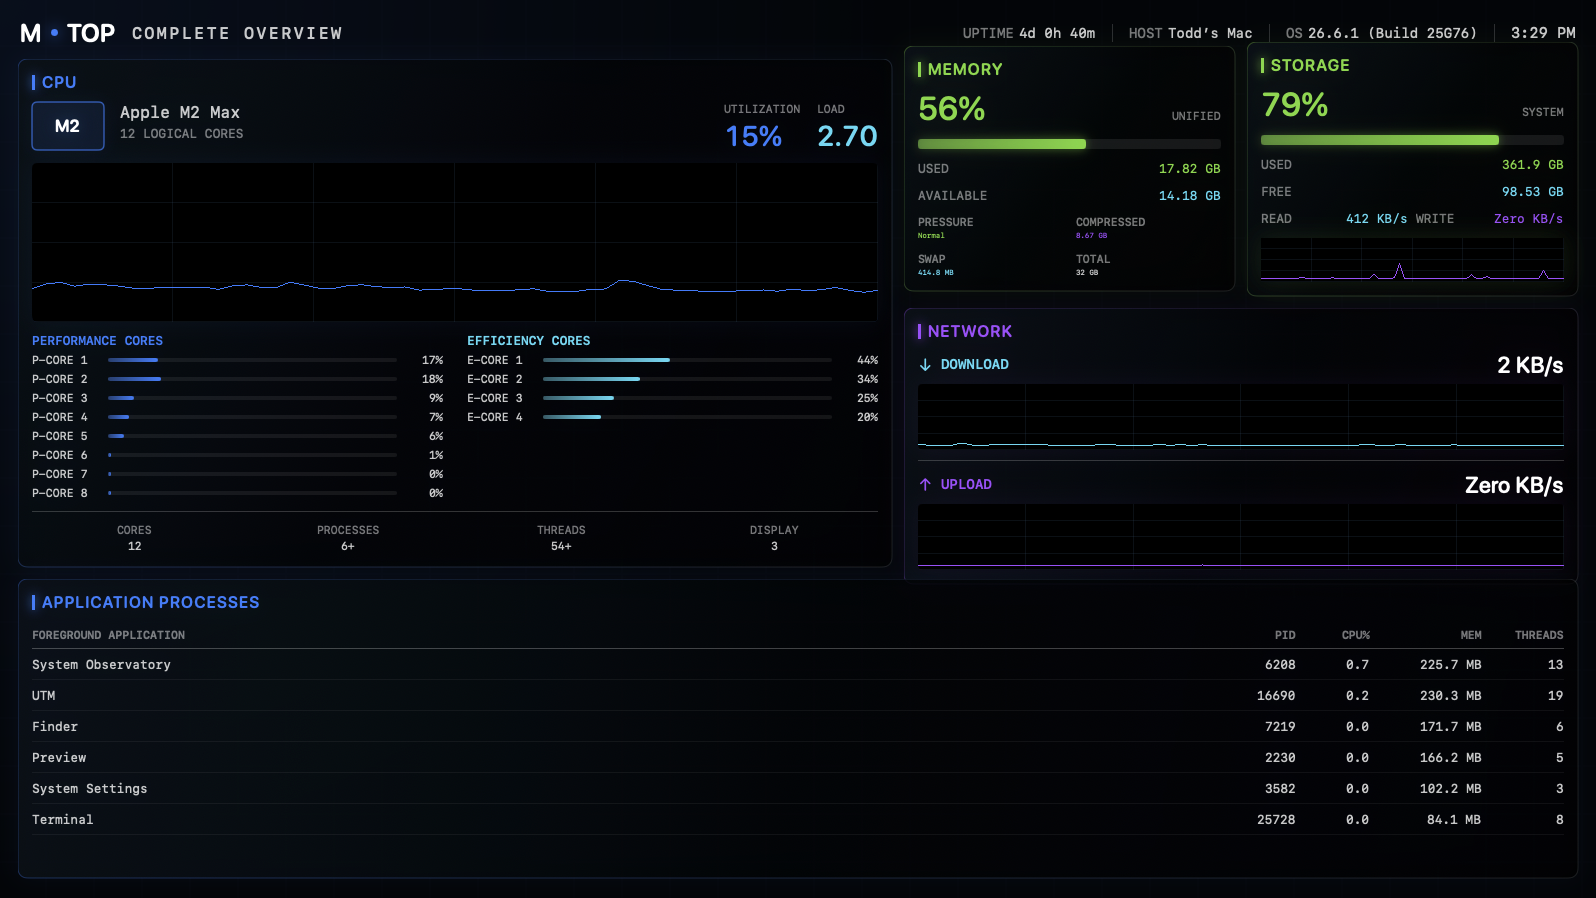
The full Mac-native dashboard across one display.
M•TOP • Modern
M•TOP preserves the system-monitor hierarchy people understand, then rebuilds it with native typography, dimensional panels, responsive layouts, and fluid Metal-backed graphs.
Official prototype image • Exact local measurementsComplete Overview
Processor topology, memory pressure, storage activity, network traffic, and foreground applications share a single readable dashboard. The result feels native to the Mac without losing the information architecture that made BTOP useful.
 View full-size image ↗
Five native views
The full Mac-native dashboard across one display.
Total history plus distinct Performance and Efficiency cores.
Pressure, compression, swap, capacity, and I/O activity.
Cyan download and violet upload histories with exact rates.
Accessible foreground applications with useful resource context.
M•TOP distinguishes collecting, available, unavailable, and privacy-protected information. It adapts density and motion without changing what a measurement means.